Talking Points:
Volume is an extremely popular trading tool when trading stocks, options, futures, and many other instruments. But when it comes to Forex, we do not see many traders using volume. The reason is that the Forex market is decentralized and the overall market volume is not available.
The solution for this is FXCM’s new Real Volume indicator. While it won’t show us how much volume is being traded world-wide, it will tell us how much volume is being traded in FXCM accounts. Due to FXCM’s large client base, we can use this to determine how volume is fluctuating on a relative basis. Today we look at trading potential breakouts and learn how real volume can validate or invalidate the move.
Identifying a Breakout
In the simplest terms, a breakout occurs when price is able to break above or below a price level that previously price was not able to break above or below. Price levels that act like a ceiling are referred to as resistance areas and price levels that act like a floor are referred to as support areas.
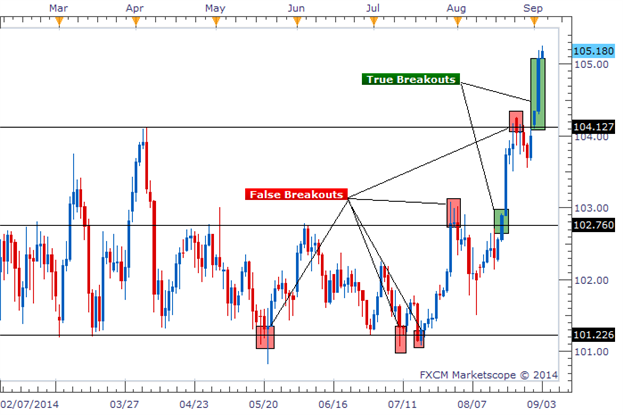
There are many ways to draw support and resistance levels. We can see on the chart below that there are times when price breaks through these drawn levels, but there are also times when price appears to break higher or lower, but then turns back around. When price movements fake us out like this, it's called a "false breakout." This is the most difficult part about trading breakouts, avoiding the false breakouts.
Learn Forex: Good and Bad Breakout Trades
Using Volume to Confirm a Breakout
This is where volume can come in handy. A fundamental principle is that the more volume traded, the more strength and determination the move has. So if we see a large price move that coincides with a large amount of volume, we respect it more than if we saw the same large price move with a small amount of volume.
When we are looking for breakout opportunities, we want to see the breakout occur on large amounts of volume. The chart below shows potential breakout entries and the amount of volume during the break.
Learn Forex: Using Volume to Find Good Entries
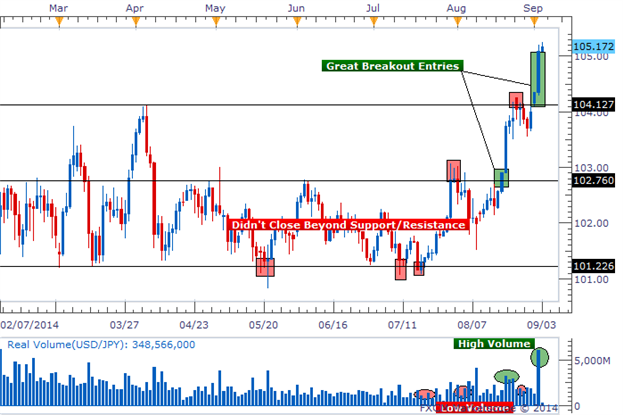
We can see the breakout trades that were filtered out, labeled in red. They were labeled as false breakouts because they either did not close beyond support/resistance or they broke during times of low volume. We want to avoid placing trades based on low volume moves.
There were only two trades where price closed beyond support/resistance and it occurred during a high amount of volume. Those were also the two times where the breakout continued moving after the breakout occurred.
In Conclusion
Breakout trades can be some of the best opportunities out there, but only if you can filter out the false breakouts. By using volume as a filter, it could give you a higher success rate. If you would like to test how real volume can improve your breakout trades.
- Volume is a free add-on from FXCMApps.com
- Volume can increase our win rate when used properly
- Larger volume during a breakout can confirm the move is valid
Volume is an extremely popular trading tool when trading stocks, options, futures, and many other instruments. But when it comes to Forex, we do not see many traders using volume. The reason is that the Forex market is decentralized and the overall market volume is not available.
The solution for this is FXCM’s new Real Volume indicator. While it won’t show us how much volume is being traded world-wide, it will tell us how much volume is being traded in FXCM accounts. Due to FXCM’s large client base, we can use this to determine how volume is fluctuating on a relative basis. Today we look at trading potential breakouts and learn how real volume can validate or invalidate the move.
Identifying a Breakout
In the simplest terms, a breakout occurs when price is able to break above or below a price level that previously price was not able to break above or below. Price levels that act like a ceiling are referred to as resistance areas and price levels that act like a floor are referred to as support areas.
There are many ways to draw support and resistance levels. We can see on the chart below that there are times when price breaks through these drawn levels, but there are also times when price appears to break higher or lower, but then turns back around. When price movements fake us out like this, it's called a "false breakout." This is the most difficult part about trading breakouts, avoiding the false breakouts.
Learn Forex: Good and Bad Breakout Trades
Using Volume to Confirm a Breakout
This is where volume can come in handy. A fundamental principle is that the more volume traded, the more strength and determination the move has. So if we see a large price move that coincides with a large amount of volume, we respect it more than if we saw the same large price move with a small amount of volume.
When we are looking for breakout opportunities, we want to see the breakout occur on large amounts of volume. The chart below shows potential breakout entries and the amount of volume during the break.
Learn Forex: Using Volume to Find Good Entries
We can see the breakout trades that were filtered out, labeled in red. They were labeled as false breakouts because they either did not close beyond support/resistance or they broke during times of low volume. We want to avoid placing trades based on low volume moves.
There were only two trades where price closed beyond support/resistance and it occurred during a high amount of volume. Those were also the two times where the breakout continued moving after the breakout occurred.
In Conclusion
Breakout trades can be some of the best opportunities out there, but only if you can filter out the false breakouts. By using volume as a filter, it could give you a higher success rate. If you would like to test how real volume can improve your breakout trades.
Comments
Post a Comment